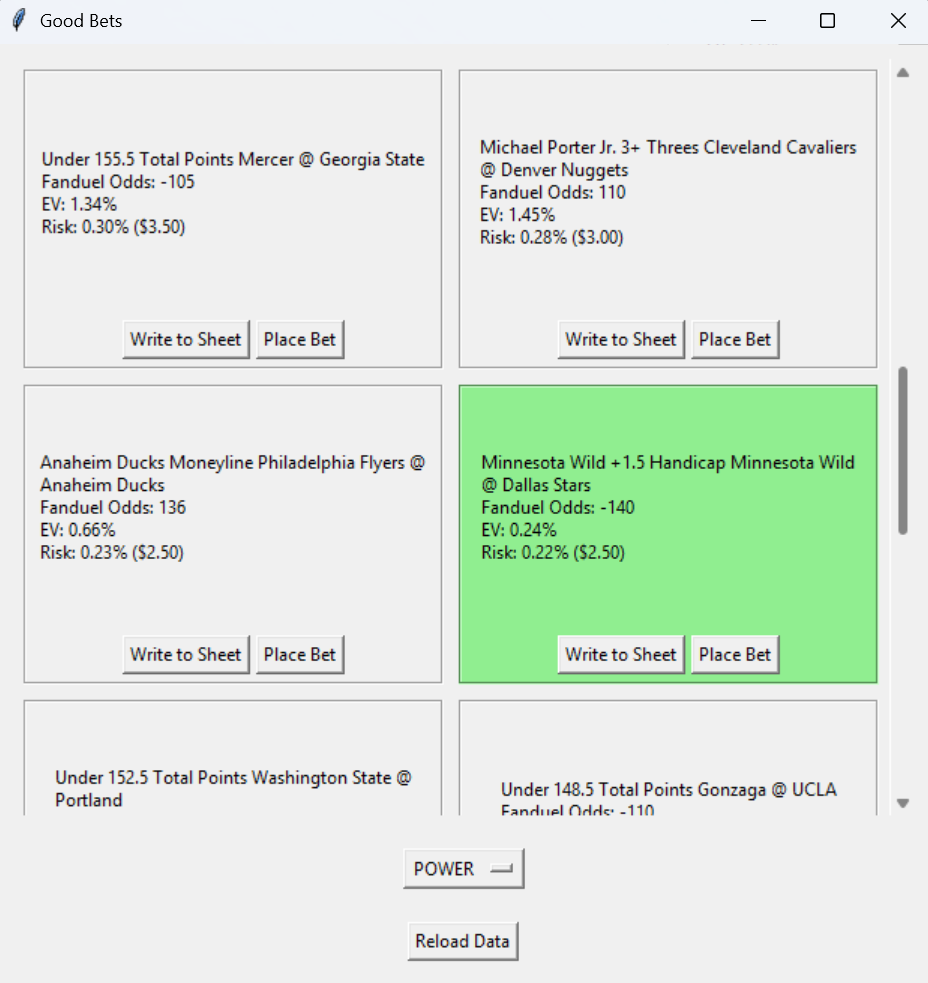
This tool (GitHub) looks at de-vigorished sports betting odds for bets offered by Pinnacle, a sharp bookmaker, and uses those to find positive EV betting opportunities on FanDuel, a soft bookmaker. Tools like this are not unique, but they are offered as a service for high fees, so I decided to make a simple version myself.
Rather than search for arbitrage opportunities, it looks for statistical arbitrage-esque market inefficiencies since sports betting “markets” are somewhat inefficient.
Details
I included support for two devigging methods: multiplicative (scales implied probabilities equally so they sum to 1) and power (does the same thing but with exponents).
To determine bet sizing, I used the (logarithmic) wager limit on Pinnacle, which indicates their confidence in their odds for a bet, and Kelly criterion, assuming the devigged implied probabilities were the true probabilities.
Exploration
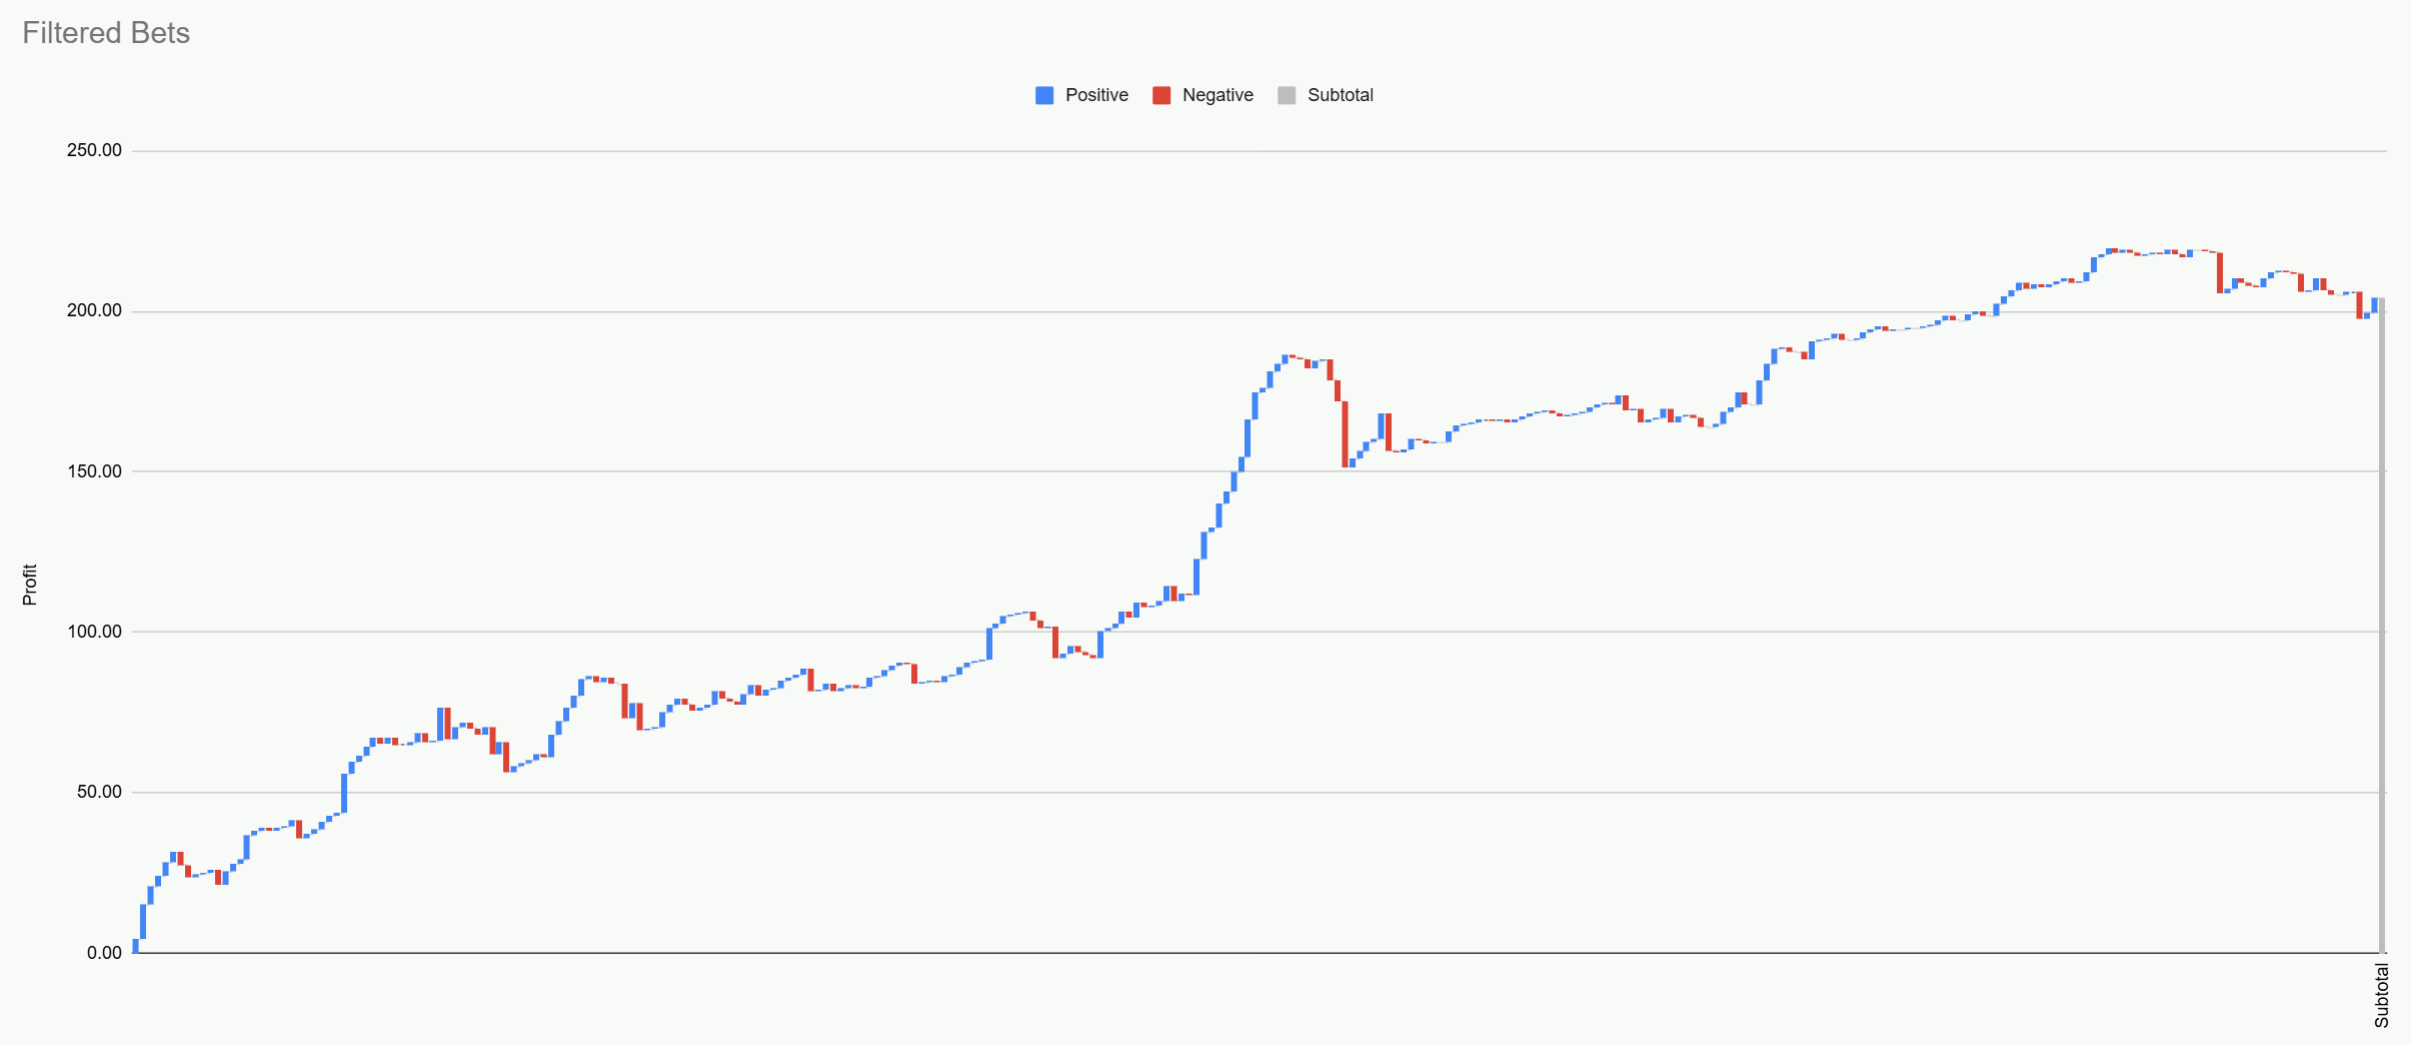
Simply placing all bets is not profitable. Pinnacle is known to be sharper for moneylines, handicaps, and totals, not so much player props. To test this idea, I simply observed results for all bets for about two weeks (backtesting is hard).
As expected, hypothetical profit for all bets steadily declined, but limiting bets to moneylines, handicaps, and totals shorter than or equal to -120 was profitable. Of course, you could use hypothesis testing here, but I like vibes. EDIT: It turns out vibes were not enough, but after some digging, it seems that even with this filter, NBA, NHL, and SHL moneylines are not profitable, e.g. Pinnacle is not sharp enough for those markets. However, NCAAB , NCAAF, and NFL moneylines (and a couple more markets) are. See the big table below for details. Underdogs being unprofitable suggests that even though the power method accounts for a larger vigorish on the underdog side, it is not enough.
Finally, I added another GUI to periodically monitor for new opportunities and send notifications, but it looks pretty much the same as the first GUI.
After observing about 700 bets, I examined how profit was affected by odds, league, and bet type. I arrived at these results:
| League | Bet Type | Odds Range | Profit | Wagered | ROI |
|---|---|---|---|---|---|
| NBA | Moneyline | -10000 to -120 | -$54.56 | $216.50 | -25.20% |
| Handicap | -10000 to -120 | -$10.50 | $16.00 | -65.63% | |
| Other | -10000 to -120 | -$18.20 | $233.02 | -7.81% | |
| Moneyline | -119 to 10000 | -$12.97 | $38.40 | -33.78% | |
| Handicap | -119 to 10000 | -$36.90 | $53.90 | -68.46% | |
| Total Points | -119 to 10000 | $0.73 | $100.40 | 0.73% | |
| Other | -119 to 10000 | $2.27 | $54.37 | 4.17% | |
| NCAAB | Moneyline | -10000 to -120 | $110.14 | $665.50 | 16.55% |
| Handicap | -10000 to -120 | -$32.58 | $110.50 | -29.49% | |
| Total Points | -10000 to -120 | $2.25 | $6.00 | 37.50% | |
| Moneyline | -119 to 10000 | $15.79 | $13.00 | 121.46% | |
| Handicap | -119 to 10000 | -$34.82 | $57.50 | -60.55% | |
| Total Points | -119 to 10000 | $15.61 | $206.20 | 7.57% | |
| NFL | Moneyline | -10000 to -120 | $18.49 | $56.90 | 32.50% |
| Handicap | -10000 to -120 | -$4.00 | $4.00 | -100.00% | |
| Total Points | -10000 to -120 | -$1.00 | $1.00 | -100.00% | |
| Moneyline | -119 to 10000 | -$8.00 | $8.00 | -100.00% | |
| Handicap | -119 to 10000 | -$5.50 | $5.50 | -100.00% | |
| Total Points | -119 to 10000 | -$3.42 | $16.00 | -21.36% | |
| Other | -119 to 10000 | $46.40 | $7.60 | 610.53% | |
| NCAAFB | Moneyline | -10000 to -120 | $37.26 | $156.28 | 23.84% |
| Handicap | -10000 to -120 | $8.30 | $19.00 | 43.66% | |
| Moneyline | -119 to 10000 | -$1.00 | $2.00 | -50.00% | |
| Handicap | -119 to 10000 | -$1.05 | $23.00 | -4.55% | |
| Total Points | -119 to 10000 | -$16.00 | $56.50 | -28.32% | |
| NHL | Moneyline | -10000 to -120 | $0.63 | $54.00 | 1.17% |
| Handicap | -10000 to -120 | -$11.12 | $84.00 | -13.24% | |
| Total Points | -10000 to -120 | $9.66 | $21.00 | 45.99% | |
| Moneyline | -119 to 10000 | -$2.50 | $2.50 | -100.00% | |
| Total Points | -119 to 10000 | -$7.52 | $9.50 | -79.15% | |
| Other | -119 to 10000 | -$5.25 | $14.50 | -36.21% | |
| SHL | Moneyline | -10000 to -120 | -$0.62 | $37.50 | -1.66% |
| NL | Moneyline | -10000 to -120 | -$6.83 | $31.50 | -21.68% |
| EPL | Moneyline | -10000 to -120 | $1.29 | $6.50 | 19.92% |
| Other | -119 to 10000 | $2.70 | $1.00 | 270.00% | |
| UCL | Moneyline | -119 to 10000 | $2.20 | $1.00 | 220.00% |
| IWF | Moneyline | -10000 to -120 | $0.50 | $11.50 | 4.35% |
| AO | Moneyline | -10000 to -120 | -$13.11 | $35.50 | -36.93% |
| Moneyline | -119 to 10000 | $0.64 | $16.00 | 4.00% |
Notice that the following bets are profitable:
For odds ≤ -120:
- NCAAB Moneyline
- NCAAFB Moneyline
- NFL Moneyline
For odds > -120:
- NCAAB Totals
- NCAAB Moneyline
- NCAAFB Handicap
- NHL Totals
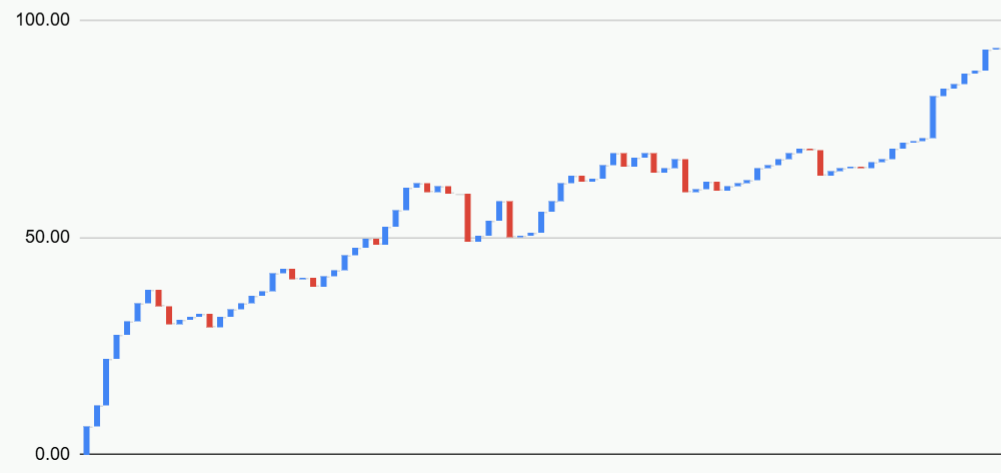
Of course, fitting your “model” to what has worked so far is irresponsible, but anecdotally, it is known that Pinnacle is sharper for lesser bet, e.g. non-big 4, leagues, which could explain why NCAAB and NCAAFB moneylines seem so profitable. Additionally, betting what has worked so far and continually adjusting to what is continuing to work seems like a good heuristic. For fun, I wanted to see what it looked like if one had only bet these profitable markets the whole time: